


Data-driven policing is a powerful approach enabling law enforcement agencies to tell their story with statistics. When agencies embrace a data-driven strategy, leadership will be able to identify patterns and formulate a plan to address problems and drive decision-making and resource allocation. They will also be able to keep public officials and the community informed about policing activities.
Law enforcement agencies need the right technology that efficiently collects and analyzes data. When a 911 call comes in, a dispatcher documents details of the call in CAD, an officer responds to an event and enters information in RMS on their computer or mobile device, and a data analyst aggregates data in analytics software to identify patterns. Analysis can be complex when agencies have disparate CAD, RMS, and mobile solutions. On a consolidated software platform, querying data from various software applications is simple.
“Collecting robust data, using it to understand our challenges, and sharing it publicly will better inform our communities and lead to more responsible decision-making by police leaders and other government officials.”
Kathy O’Toole, former Boston Police Commissioner and Seattle Police Chief
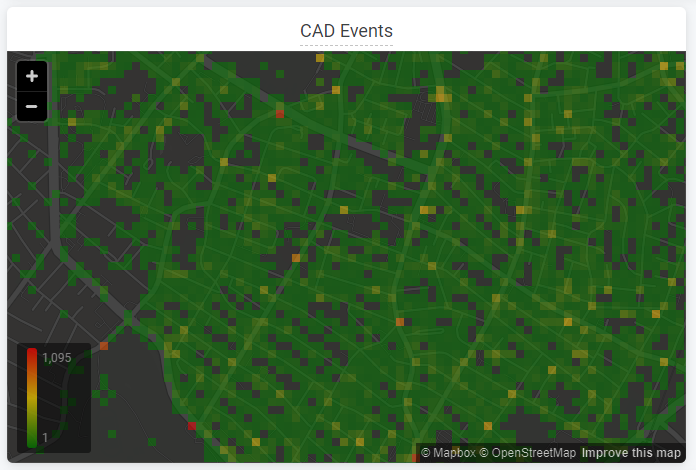
Tracking and analyzing calls for service data goes beyond crime statistics. Call for service information provides visibility into officers’ daily activities, and specifically the locations and types of calls to which they are regularly responding. If your agency actively reviews when, where, and why your community is seeking a police response, you can develop policing strategies that more effectively align with your community’s needs. Here are a few ways your agency can leverage call for service data to make informed decisions to enhance public safety.
Develop a strategy based on top calls
One of the first things your agency can do is identify the top call types. When Kathy O’Toole was Seattle’s Chief of Police, they wanted to start understanding call data to capture a more accurate picture of what officers were doing beyond crime. The call data showed officers answering 10,000 mental health crises calls a year, with 50 percent of those calls involving people who were posing a threat to themselves or the community and 10 percent of calls involving an armed individual. In response to that data, they expanded the use of the Crisis Response Team and created a Navigation Team to address people experiencing homelessness, addiction issues, or who were in mental health distress. Without this data, they may not have been able to develop thoughtful approaches to meeting the needs of the community.
Call data can also help your agency to identify areas for operational improvements. For example, if your agency responds to elevated levels of domestic violence calls in certain areas or at particular times, you can provide assigned officers with additional training and support to equip them to effectively address and de-escalate these situations.
View trends overtime
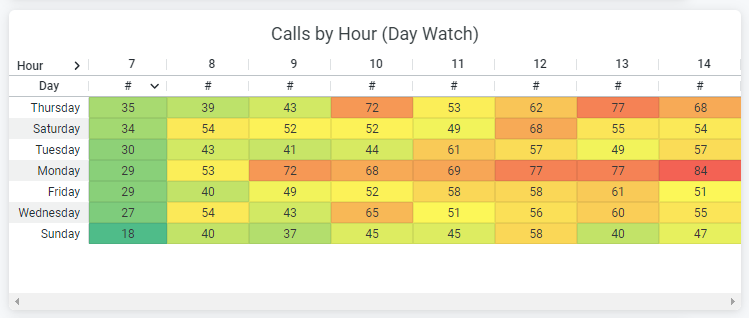
Tracking call volume over time, from month-to-month and year-to-year, provides another important public safety measure. Analyzing and understanding these seasonal trends allows you to update and refine your policing strategies. For instance, tourist destinations may have seasonal call patterns due to an influx of people in the area during certain months. Understanding when this happens allows your agency to plan accordingly and prepare for busier times of the year.

Understand if you’re staffed appropriately to respond to your community
Finally, we know the majority of public safety agencies are facing staffing shortages. Analyzing call volume patterns will help you predict and allocate resources to those times when the community needs you most. When you have quick visibility into which days and hours are busier, you will be able to create informed staffing schedules based on expected call volume.
Call data can also help your agency diagnose whether you have enough officers to expeditiously respond to incoming calls. For instance, are your officers constantly going from call to call with no time for community policing activities? Are response times getting longer? Are there certain call types where police intervention may not be necessary, and alternative response methods may help free up law enforcement resources to focus on crime-related calls? With this data, you can demonstrate and effectively advocate for both agency and community needs.
Conclusion
Using call for service data, public safety agencies can identify operational patterns, develop informed strategies, and communicate with critical stakeholders. Agencies can more easily adopt a data-driven strategy when technology is on a consolidated platform that facilitates seamless data entry and analysis.
See how Mark43’s Public Safety Platform delivers a seamless experience from data entry to analysis. Book your demo today to learn more.